Digital Newsletter
Each week our editor Phil Alsop rounds up the most popular articles, videos and expert opinions. We compile this into a Digital Newsletter and send it straight to your inbox every week.
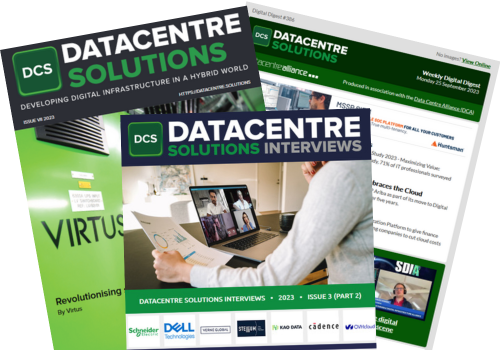
Digital Magazines
We'll let you know each time a new edition of Data Centre Solutions is released so that you're always kept up-to-date with the latest and greatest news and press releases.
Video Magazines
The Data Centre Solutions Video magazine contains the latest Zoom interviews with experts in the industry.
Salesforce.com has just introduced new reporting capabilities for Salesforce1 Mobile App that the company claims will deliver the most complete, customisable and open reporting experience in a single app.
The goal is to reach the point where any user can run their business from their phone. The additions will allow every Salesforce1 user to instantly unlock answers found within their business data and take informed actions to move their business forward.
Salesforce1 Mobile Reports & Dashboards will allow users to instantly access, analyse and act on business data from anywhere. It works through a single interface to connect users to everything that is important to their business and enable them to instantly complete any process or action.
New Reporting and Dashboards APIs will, the company claims, revolutionise the way customers analyse data in Salesforce. Developers will now have programmatic access to report data that can be integrated into any web or mobile app—inside or outside the Salesforce1 Platform. They can even use rich visualisations from third-party chart libraries to animate Salesforce data, giving users the ability to further customise reports and dashboards for their own use.
Users will be able to drag and drop charts and dashboards directly onto record detail pages for any standard or custom object, bringing together critical data points that accelerate action. In addition, users will be able to instantly post snapshots of any chart to their Salesforce1 Chatter feed to initiate a conversation around the data. Charts and dashboards have always served as great alignment tools, and now teams will be able to collaborate around real-time information and reach a consensus on the next action—directly within the feed.
“Having instant visibility into business data is no longer a luxury,” said Keith Bigelow, senior vice president and general manager, big data and analytics, salesforce.com. “With Salesforce1, customers can act on business information in real-time.”
Well-designed dashboards are a vehicle to deliver critical updates and key metrics across the organisation, informing actions across the C-Suite and down to the line of business. With the new Reporting and Dashboards APIs, companies will be able to take advantage of open charting libraries, including Google Charts, D3.js, CanvasJS, Chart.js, HighCharts JS and RGraph.
They will also have greater flexibility to create and customise their own charts or embed them into custom apps, delivering a whole new way to engage in rich data experiences on a mobile phone.